Metrics Review Best Practices: Turning Experiment Data Into Decisions

Metrics Review Best Practices: Turning Experiment Data Into Decisions
Think metrics reviews are just slide decks and spreadsheets? Think again. These meetings are where experiments get greenlit, backtested, or sent back to the drawing board. They're the difference between shipping something with confidence—or shipping something that quietly breaks core business metrics.
If you’ve ever run an A/B test and walked into the review feeling 80% sure and 20% terrified, you’re not alone. The good news? With the right approach, you can turn messy results into clear decisions—and maybe even secure your team's next big win.
This is the real guide to running metrics reviews that lead to actual, confident decisions—not endless "let’s revisit in two weeks" loops.
The Infrastructure That Supports the Culture
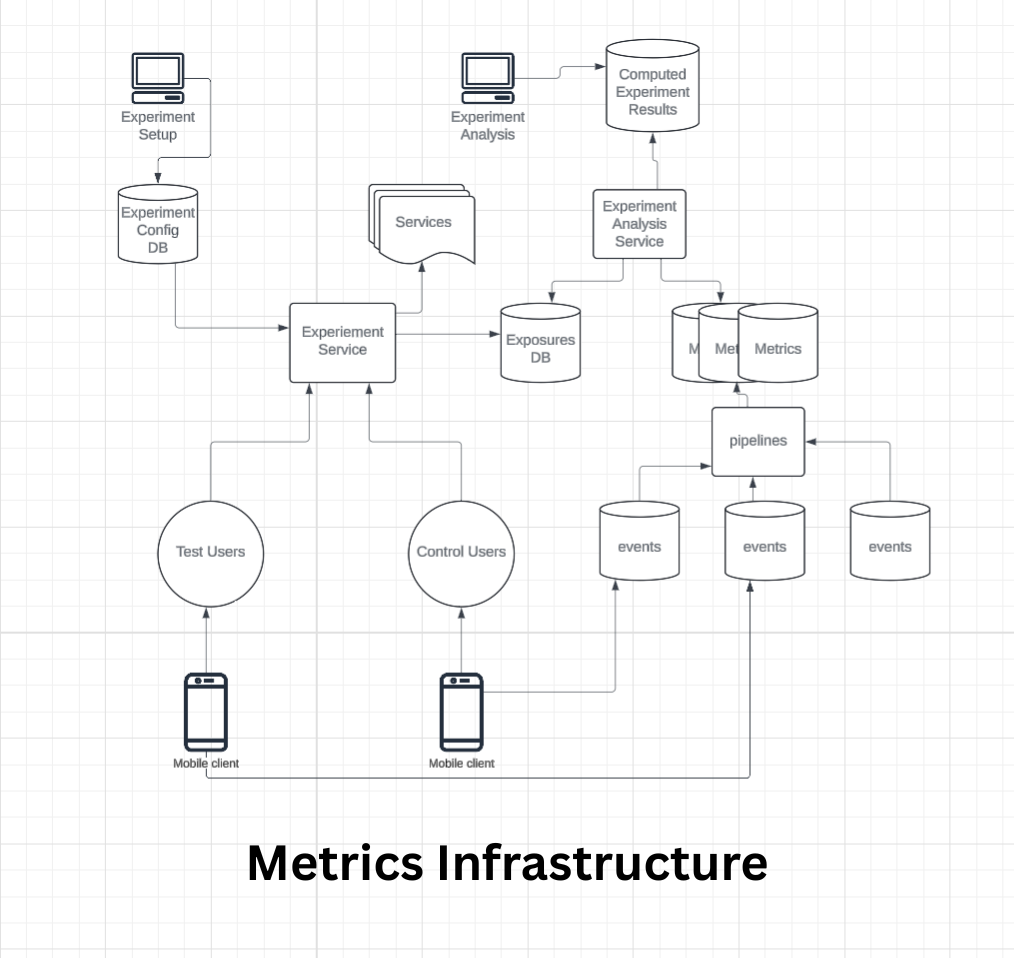
Great metrics reviews don’t start in the meeting—they start way before it. Your team’s data pipeline, metric definitions, and experimentation tooling form the foundation. If those are shaky, no analysis will save you.
Strong orgs treat this like infrastructure, not an afterthought:
- Pre-registered metrics avoid cherry-picking.
- Trusted dashboards (auto-updated, version-controlled) avoid last-minute scrambles.
- Audit trails for experiment configs make it easy to validate exposure, flags, and targeting logic.
If you’re spending the first 15 minutes of a review arguing over why the signup rate is defined differently in three tools, you’re not doing decision-making—you’re doing forensics.
Pro tip: Build shared metric definitions into your platform or experimentation tool. It turns hours of alignment into minutes.
What’s a Metrics Review Meeting, Actually?
It’s not a retro. It’s not a status update. It’s not a “demo the shiny graphs” hour.
A metrics review is a decision checkpoint. You’ve run an experiment. You’ve got data. Now you need to:
- Decide whether to ship, not ship, or revisit.
- Validate whether experiment setup was correct.
- Discuss if it’s worth backtesting or rerunning.
- Align on whether this experiment meaningfully moves the needle—or is just noise.
The most effective reviews feel more like product decisions than science fair presentations. And they have the right people in the room to make those decisions.
The Real Goal of a Metrics Review
It’s simple: reduce decision ambiguity.
Your team needs to walk out of that room with a confident call:
- Greenlight to ramp
- Rollback if something's off
- Reframe if the learnings weren’t what you expected
You’re not just reviewing metrics—you’re reviewing confidence in the setup, the results, and the implications.
What separates strong teams? They’re not afraid to say “we need to rerun” or “this isn't actionable yet.” A clean stop is better than a hesitant ship.
How to Successfully Present During the Review
This isn’t a solo sport. The best readouts are joint efforts between:
- Engineering Leads or EMs who understand impact and risk tradeoffs
- Analysts or data scientists who walk through methodology with precision
What great presenters do:
- Lead with the decision you recommend, not just the data.
- Anticipate setup questions. Was exposure uniform? Were cohorts balanced?
- Acknowledge edge cases or inconsistencies before someone else flags them.
- Use real words, not just charts. Translate findings into business impact.
Pro tip: Include a one-slide TL;DR with clear “Recommend: Ship / Hold / Rerun” guidance at the top of your deck. Busy stakeholders thank you.
Handling Disagreement Without Derailing
Metrics reviews can get heated. Data challenges egos, and egos challenge decisions. The most effective teams:
- Keep debates time-boxed—no 40-minute detours into statistical theory.
- Separate facts from interpretations—what the data says vs. what we think it means.
- Document disagreements in the readout, along with the final decision.
Healthy tension is fine; paralyzing debate is not. The goal is to move forward with the best available evidence.
When to Break the “Ship or Stop” Rule
In most cases, a metrics review should end with a clear, binary decision: Ship (roll out the change) or Stop (kill it or revert). This decisiveness keeps teams moving and avoids analysis paralysis.
But real-world experiments don’t always fit neatly into a yes/no box. Certain scenarios call for breaking the “ship or stop” rule—intentionally, not accidentally.
1. When the Data Is Inconclusive, But the Stakes Are High
Sometimes an experiment is underpowered or results are close to the margin of error, yet the decision carries strategic weight.
Example: A change to your billing flow shows a +0.7% lift in conversions (p=0.12). Statistically, it’s not significant. But if implemented, it could generate millions in annual revenue with minimal downside risk.
Possible action: Ship to a small, monitored cohort and keep running the test in parallel to gather more evidence with a backtest.
2. When External Factors Compromise the Test
Even well-planned experiments can be distorted by outside events:
- Seasonality spikes (e.g., Black Friday traffic)
- Major outages affecting user behavior
- PR events or marketing campaigns skewing traffic mix
- Possible action: Pause or reset the experiment, document the anomaly, and rerun under normal conditions.
3. When You Discover an Unexpected Opportunity
An experiment designed to test one thing may surface a more valuable insight elsewhere.
Example: You test button copy, but in reviewing the data, you notice a surprising lift in mobile retention due to a layout change in the same branch.
Possible action: Design a follow-up experiment focused on that new opportunity, rather than making a hasty ship/no-ship call on the original hypothesis.
4. When Results Are Neutral but Operational Impact Is Positive
Even without a lift in primary metrics, an experiment might:
- Reduce infrastructure costs
- Simplify code complexity
- Improve accessibility or compliance
- Possible action: Ship for operational benefits while documenting that there was no measurable customer-facing lift.
5. When Guardrail Failures Need Further Investigation
Sometimes the primary metric is positive, but a guardrail metric is flashing red.
Example: Conversion is up +4%, but support tickets are up +20%.
Possible action: Hold rollout until a deeper root-cause analysis explains the trade-off.
6. When the Decision Is Strategic, Not Just Statistical
Some decisions are made for brand, regulatory, or competitive positioning reasons, regardless of test outcomes.
Example: Introducing a privacy feature may hurt short-term engagement but is essential for long-term trust and compliance.
Possible action: Document the rationale and ship with full acknowledgment that it’s a strategic call, not a metrics-driven win.
Key Principles When Breaking the Rule:
- Be explicit—call out in the readout that you are making a non-binary decision and why.
- Document assumptions and next steps so future teams can evaluate whether the choice paid off.
- Set a review checkpoint (e.g., in 30 days) to revisit whether the chosen path is delivering the intended outcome.
Breaking the “ship or stop” rule should be rare—but when done deliberately, it’s a sign of mature decision-making, not indecision.
Which Metrics Belong in the Readout?
Not all metrics are created equal—and throwing 30 of them in a deck is a fast track to confusion.
Here’s what you actually need:
- Goal metrics: The one(s) the experiment was designed to move. Be crisp. Did we increase conversion? Improve time-to-value?
- Guardrail metrics: These are the ones you don’t want to break. Think: NPS, support tickets, latency. They protect you from shipping harmful changes.
- Directional metrics: Optional. Include only if they add insight, not noise. Example: average session time to support a conversion lift story.
Avoid: metrics you didn’t pre-specify. Post-hoc fishing usually leads to bad decisions.
Common Pitfalls (and How to Avoid Them)
Even smart teams fall into traps. The usual suspects:
- Imbalanced exposures: One group gets more high-intent users than another? Your lift may be fake.
- Dilution: If only 10% of traffic sees the change, your effect size will vanish unless you filter appropriately.
- Misaligned cohorts: Are you measuring impact on all users… when only some were eligible? That’s noise, not signal.
- Underpowered tests: If your experiment ran for 3 days with low traffic, confidence intervals will be so wide that any decision is guesswork.
Fix it fast: Use pre-check dashboards to catch these before reviews. And don’t be afraid to call out issues honestly in the readout.
From Design Doc to Decision: Closing the Loop

A solid metrics review doesn’t start with the analysis—it starts with the design doc.
Before any lines of code get merged, the experiment should be documented with:
- The hypothesis
- The goal and guardrail metrics
- The target audience
- The planned duration
- The success criteria
This isn’t red tape—it’s how you set yourself up for a decision-ready review.
The best metrics reviews:
- Reference the original design doc to anchor what was intended
- Call out any deviations in implementation or targeting
- Compare expected vs. actual outcomes
Pro tip: Add a “Metrics Review” section at the end of your experiment design doc. Use it to link to the final readout, include screenshots, and record the decision made. This builds institutional memory and prevents rerunning the same ideas next quarter.
Design docs create clarity up front. Metrics reviews deliver accountability at the end. Together, they close the experiment loop—and help your team learn faster over time.
Creating an Institutional Memory of Learnings
One of the fastest ways to waste time and resources is to forget what you’ve already learned. Without a deliberate system for recording and sharing past experiment outcomes, teams end up re-running the same tests, repeating the same mistakes, and losing valuable historical context when people leave the company.
A strong institutional memory turns your experimentation program from a set of disconnected trials into a compound learning engine. Here’s how to build it:
1. Centralize the Archive
Keep all experiment records in a single, searchable place—whether that’s a shared Google Drive, a Confluence space, Notion database, or a dedicated experimentation platform. The key is one canonical home for:
- Design docs with original hypotheses and planned metrics
- Final readouts with annotated graphs and interpretations
- Decision logs capturing the outcome (ship, stop, rerun, pivot)
- Follow-up actions and their eventual impact
2. Standardize the Format
Without consistent structure, your archive becomes a junk drawer. Use a template that covers:
- Experiment title and date range
- Owner(s) and contributors
- Hypothesis (and why it was worth testing)
- Primary and guardrail metrics
- Sample size and audience
- Results summary (statistical significance, direction, magnitude)
- Business interpretation (what this means beyond the numbers)
- Decision taken
- Links to dashboards and raw data
3. Tag for Easy Retrieval
The magic of an institutional memory is being able to connect dots across different projects. Tag experiments by:
- Theme (e.g., onboarding, pricing, retention)
- Business unit or product area
- Metric impacted (conversion, NPS, churn)
- Result type (positive, negative, inconclusive)
This makes it easy to search for “all onboarding experiments that improved conversion in the last 18 months” without reading every doc.
4. Link to Related Experiments
Insights rarely live in isolation. Use your archive to link related tests:
- “This onboarding copy test built on findings from the February 2024 CTA experiment.”
- “We re-tested the paywall layout from last year, with updated targeting.”
This prevents “groundhog day” experiments where no one remembers the last run.
5. Keep Learnings Alive in Planning
The archive isn’t just for historians—it should feed directly into new experiment planning:
- Quarterly planning: Review recent wins and losses to identify promising follow-ups.
- Hypothesis generation: Browse prior results for surprising patterns worth re-testing.
- Guardrail checks: Use past guardrail failures to stress-test new designs before launch.
6. Assign Ownership
A repository without maintenance becomes stale fast. Assign a specific role (e.g., an experimentation program manager, analyst, or rotating PM) to:
- Ensure every experiment gets logged.
- Validate that templates are filled out completely.
- Periodically audit tags, links, and data access.
When maintained well, your institutional memory becomes a force multiplier: every new test benefits from the accumulated wisdom of all previous ones, turning experimentation from one-off trials into a compounding competitive advantage.
Conclusion: Metrics Reviews Are Decision Reviews
A metrics review isn’t just a data exercise—it’s a product decision checkpoint. You’re not just proving significance. You’re deciding what to do next.
When done right, these meetings:
- Make experiment outcomes actionable
- Build trust in experimentation processes
- Prevent wasted sprints chasing false positives or ignoring true wins
Remember: Good reviews don’t just analyze experiments—they compound learnings over time. That’s how orgs get smarter, faster.
So next time you're prepping your readout, don’t just build charts. Build a case. And lead your team to the clearest next step.
✉️ Get free faang interview cheat sheet and interview tips weekly
✉️ Get free faang interview cheat sheet and interview tips weekly